The Data
After a long period of waiting, and a short period of complaining, I’ve received my personal data from UBC’s Learning Management System (LMS), Blackboard Connect. I’m impressed with, and unsettled by, the amount of data that I’ve been given. It’s from every course at UBC that I’ve ever been enrolled in, including those that I dropped before classes began, and those that never even used Connect.
The documents include a 212-page PDF of Course Reports. These are the records that instructors can generate from within the Connect environment and evaluate student performance. They are a component of the Blackboard Learn tools that offer this lofty promise: “As you monitor student performance in your course, you can ensure all have an opportunity for success.”
Below are screen shots from that document. They show what an instructor sees when assessing student performance and assigning grades like participation through Connect. It demonstrates how students can be unfairly evaluated and is evidence of how Connect is failing to deliver upon its ambitious promise.
Course Activity Overview

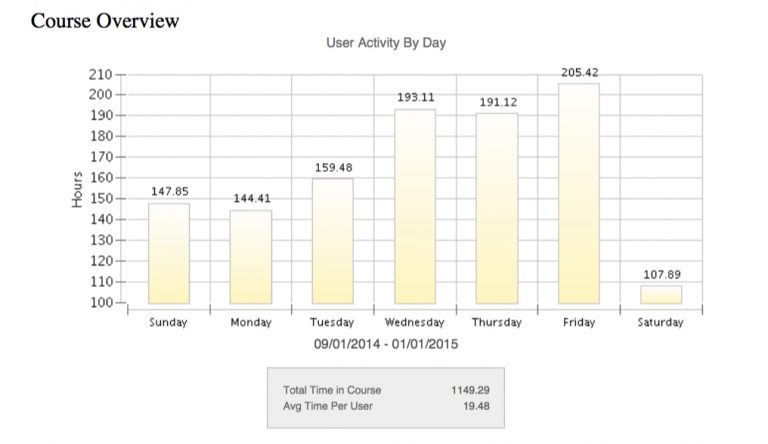
The most important statistic in this image is the average time per user displayed on the bottom. This gives the instructor an idea of how an individual student’s performance relates to the rest of the class. In the case of my course, students were using Connect for an average of 19.48 hours each week. However, this statistic might be very misleading for instructors.
The practices for each student using Connect is heavily varied. Some may leave their browser windows open for extended periods of time, working on assignments and writing discussion board posts from within Connect, which will amount to a greater average time. Whereas others might complete their work outside of Connect and enter only briefly to submit their completed work.
How might these varied practices impact the participation grades of different students? Perhaps, a student with limited access to the internet would be discriminated against based on this performance tool as they would perform poorly compared to a student with a constant internet connection, who can login into Connect as frequently as they like. As well, a student who simply engages differently with Connect may receive a poorer grade in reflection of their practices and not their participation.

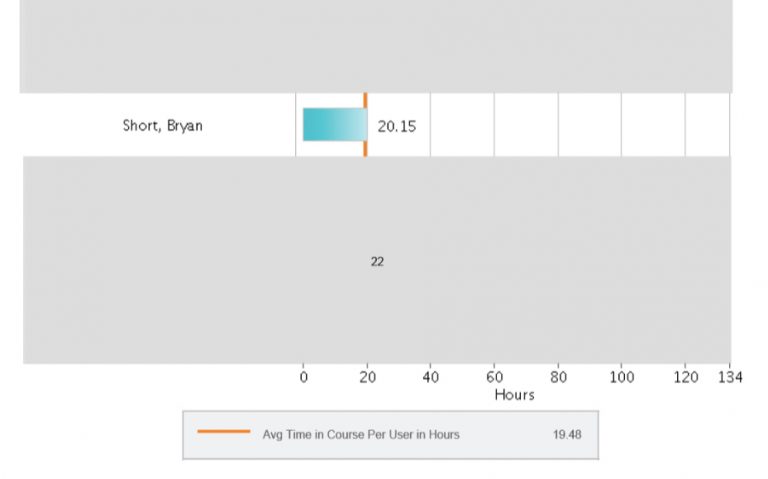
The above image shows my performance as compared to the class average. The blue bar represents the amount of time that I spent within Connect and the orange line is the average threshold, which I marginally surpassed. I would expect that instructors would take a cursory glance at this graphic to get a sense of where students are situated within their class.
In terms of my practices within Connect, I would do very little actual reading or writing within the system. I found that writing in the small window for discussion board posts and journal entries to be constraining and difficult. I also didn’t like going through the burden of logging in each time I needed to access a reading. So I’d often log in, download the readings, check what had been posted, and then write my posts and do my readings from outside of Connect. But during this time of relative inactivity, to my great benefit, I’d leave Connect open. If I hadn’t, my average time in course would be significantly lower.
In this course, I was slightly above the average in terms of time spent in course each week. Above and below me, there would be students who performed better and worse (to protect their privacy, their information has been redacted by UBC’s Office of Counsel). I would hope that instructors wouldn’t pay too much attention to the arbitrary statistic of average time spent in course. As limited means of access, and different practices from individual students, would heavily influence this field and make this a very biased means of evaluation.
The Performance Dashboard

The Performance Dashboard is another Connect Learn tool that instructors can use to evaluate students. Importantly, this is where a student’s total number of discussion posts are listed. It also informs instructors when a student is not logging into a Connect course often enough. This information is provided in the Days Since Last Login column. Note that the timestamp contains the precise second of the login.

As this course ended a couple of years ago, the table indicates that it has been 651 days since my last login. These statistics would be in comparison with other students, whose data would be above and below my own (again, redacted by UBC’s Office of Counsel for privacy). The kind of comparative analysis based on arbitrary statistics presented by the Performance Dashboard is highly suspect and goes against the standards of academic rigour.
Below, you can see how recent my last activity was on the discussion board and in my journal, my total post submissions and journal entries, and total submissions. Carefully monitored and heavily scrutinized, this data could be useful in providing a very basic comparison between students in the class. However, taken into consideration only at this level, it would be quite biased. For example, if my discussion board posts were all very short and not very useful, I might be graded better than someone who had less posts, but whose posts were much longer and of much greater value.
This kind of analysis is dangerous because it’s very superficial and does not consider the quality of the content of a student’s work. If an instructor were to rely on this tool, then the grade that was derived from this information would not be representative of the actual effort that a student had put into the course, and would be very unfair reflection on the student.


Student Activity Overview

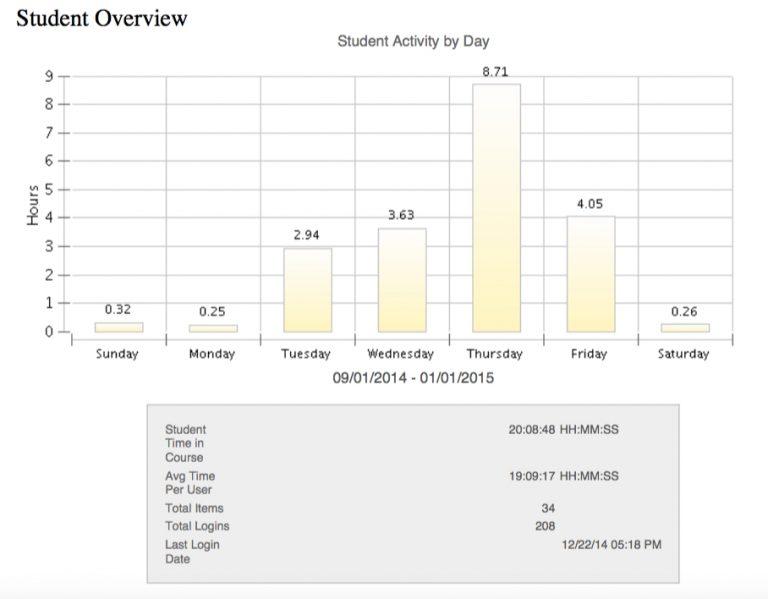
This is a breakdown of my weekly Connect usage for this course. It could give an instructor an idea about when and how often a student is accessing the materials. For example, it looks like I’m heavily favouring Thursdays and, as I recall, assignments and discussion forum posts were due on Fridays in this course. This might give an instructor the impression that I’m leaving my course work until the last minute. Whereas, it could be the case that I’m preparing my assignments offline and taking the time to edit and improve them up until the deadline before I submit them.
Likewise, a student with limited access to the internet might have all their interactions with Connect during very brief periods, only a couple of times per week. Looking at a statistical analysis like this, the instructor could get the impression that the student is not sufficiently engaged with the materials, despite all of the time offline that the student is putting in.


These images show the total number of times and initial access time that I accessed course documents within Connect. For an online course like this one, it allows the instructor to see if a student is moving through the course modules at an appropriate pace, and provides them with an easy explanation if a student is not performing adequately.
But, as mentioned before, some students may not access Connect frequently, despite their engagement with the materials. For example, a student might download all the course modules at once and then access the materials offline. In the Performance Dashboard, that student wouldn’t appear to be performing very well.
If I were to take an online course in the future, I wouldn’t necessarily want this level of surveillance and scrutiny: this information is likely only to be used as evidence for why a student struggled in a course. There could be many reasons why a student might perform poorly, and the time at which a student initially accessed a learning module is not necessarily indicative of that student’s performance. In the future, I would go through and open all of these modules on the first day I accessed the course within Connect so that this data couldn’t inform my participation grade.
Value of the Data
It is my belief that the data being collected and provided to instructors through Connect’s learning analytics are a threat to the unbiased evaluation of students at UBC. The comparative presentation of these statistics are not indicative of the actual efforts of students and creates undue risk for them to be assessed on factors that are completely unrelated to their engagement with course materials.
And because this harm far out weighs any tangible benefits, I believe that UBC should stop collecting student data through learning analytics on Connect. Or, in order to better address these concerns, students should have complete, un-redacted access to these documents so they can understand how they’re being assessed in comparison to their peers. This would give them the opportunity to either change their working practices, or to at least argue and have evidence that they’re being unfairly evaluated.
But the most obvious means of addressing these concerns would be removing instructor access to these reports, which provide such cursory information that it can only mislead their grading practices, and offers far more potential for harm than any possible positive effects.
The Video
Two UBC students talk about how they use Connect and then watch a video that explains how Connect collects student data and generates reports that instructors can view. They express concerns about how this data is collected and about the affect that it may have on their grades. Overall, they believe that a more transparent framework needs to be established because of the potential impact of this data collection.
What do you think?
How might you change your practices on Connect now that you know more about how you’re being assessed? Do you think that any of your habits have influenced your grades in unfair ways? Would you like to see the data collection on Connect through learning analytics be disabled?
The Blog Series
The Connect Exposed blog series documents my inquest into data collection on Blackboard Connect, the difficult process of obtaining my data from UBC, and privacy concerns around the collection of student information.


Thanks for sharing a nice article really such a wonderful site you have done a great job once more thanks a lot.
Hi Bryan, not sure if you’ll have come across this discussion paper, but from my perspective it’s one of the best I know of in terms of considering the ethical issues and dilemmas regarding use of data (in all directions). Worth a read!
Slade, S., & Prinsloo, P. (2013). Learning analytics: Ethical issues and dilemmas. American Behavioral Scientist, 57(10), 1510-1529 http://journals.sagepub.com/doi/abs/10.1177/0002764213479366
Hi Leah,
I haven’t come across that paper before. There’s a lot of overlap between the issues it discusses and the blog series: the unequal power relationship between institutions and students (even the comparison to the panopticon!) and the discussion about informed consent. But there’s also a lot of things that I hadn’t considered.
It was interesting to read about the bias that is created when grouping students. I also really liked “Principle 3: Student Identity and Performance are Temporal Dynamic Constructs” (1520), which argued that students’ digital identities are constantly evolving and shouldn’t judged too harshly on past behaviour. This theme is especially in relation to the Digital Tattoo. In fact, it goes on to say: “Student profiles should not become ‘etched like a tattoo into … [their] digital skins'” (1520).
Likewise, I see the merit in “Principle 6: Higher Education Cannot Afford to Not Use Data” (1521). This article should be required reading for anyone working in the field of learning analytics and I regret not having read it before writing the blog series. It raises so many good points. These are exactly the kinds of things that students should be thinking about if they’re to give informed consent to the use of their data. It should be broken down and written as an easily accessible manifesto!
Thank you for sharing!
Bryan
Hi Bryan, it’s interesting to read about your first encounter with Blackboard data. I think it’s important to note, though, that what you’re actually complaining about is Blackboard (ie ‘Connect’) and what *they* are calling ‘learning analytics’ (and I agree that there’s lots to complain about). Actual ‘learning analytics’ as a field of research and implementation goes far beyond learning management systems (LMS) like Blackboard products, and may not involve LMS data at all. It encompasses many different kinds of data, intentions and analytic approaches. And much of it is still actively at the research and prototype stage. What Blackboard (the company) packages up as ‘learning analytics’ and flogs to educational institutions, and the claims they make about its reliability, accuracy, potential and uses, are a bit of a black box (no pun intended) and to the best of my knowledge not supported by any robust published research.
If you’d like to explore the wider field of learning analytics, join us at the annual Learning Analytics and Knowledge conference (LAK17), hosted in March by SFU: http://lak17.solaresearch.org/
You might even find some Blackboard folks hanging around whom you can pitch your arguments to directly.
Leah
Hi Leah,
Thanks for noting that I’m using the wrong term when writing about learning analytics on Connect. I’d love to learn more about the actual research field of learning analytics and what it has to offer students and educators. Even after listening to just one presentation at the LAVA meeting this week, I’m much more confident in its potential.
I’ll make plans to attend some of the LAK17 conference. I’ll also be at the LAVA meeting on March 7th discussing this project and hearing more about the field of learning analytics.
Thank you for sharing!
Bryan
Hi Bryan,
Thank you for sharing this. I agree that the data can be very misleading. I think, for the most part though, that instructors are aware of that fact and use the data cautiously. I believe there is a place for learning analytics and that their potential should not be disregarded.The solution here is not to “throw out the baby with the bathwater” as it were. The best and most obvious solution, seems to me, to simply give all stakeholders the same access to the same data. That way, if a student looks at their data and feels it misrepresents their performance, they can make contact with their instructor. Similarly, if an instructor is concerned a student’s engagement with the course is diminishing off, they can make contact with the student. If nothing else, it opens the door to communication.
With the current distribution of access to data, there is the undeniable potential for instructors to misconstrue the data and use the data as the basis for unfair grades but if we could all access the data, we could use it to inform and empower our learning (as students), inform and enhance our instruction and assessment (as instructors) and identify problems with the analytics and suggest solutions (as a community).
Hello Anne,
Thanks for reading. I absolutely agree with you that there’s both good and bad potential for Learning Analytics. My exploration is largely focused around the bad because Blackboard has provided plenty of rhetoric around the good. But I’ve yet to hear of any examples struggling students being identified and assisted at UBC through Connect’s Learning Analytics. (This despite internal requests to be put in contact with instructors using Connect to this end, and external postings soliciting instructors to provide feedback on Connect.)
However, since publishing these blog posts and writing about the very real threat that Learning Analytics poses to the fair and unbiased assessment of students, I’ve had the opportunity to meet and speak with several UBC instructors who refuse to look at the analytics or use Connect for these very reasons. Not to be overly pessimistic, but to borrow from your analogy: we should take reasonable precautions and remove the baby out of the bath while we redraw the water; there’s too great a risk and far too little benefit with the current system of Learning Analytics to keep forcing students to use it. UBC should disable Learning Analytics until it is capable of implementing a system that can make better, more ethical, use of the data and can generate meaningful consent with its students, which means revising the terms of service and, as you’ve suggested, sharing the data more openly.
I think that you’ve beautifully summarized the potential for Learning Analytics in your consideration of all the stakeholders of the system: students, instructors, and the community. If the focus remains on those three considerations, then the future of Learning Analytics is promising. We just need to keep that focus equally distributed.
Bryan